Supply Chain Services Reports
If your organization uses Radial's Supply Chain Services for fulfillment and transportation management, you have access to several reports that provide valuable information on your carriers' performance.
These reports provide information on cost and volume, carrier performance, and more. You can access the reports through the Logistics Dashboard. To see data on a chart or graph, hover over the data.
Features
At the top of the screen is a menu with the following choices:
-
Home
-
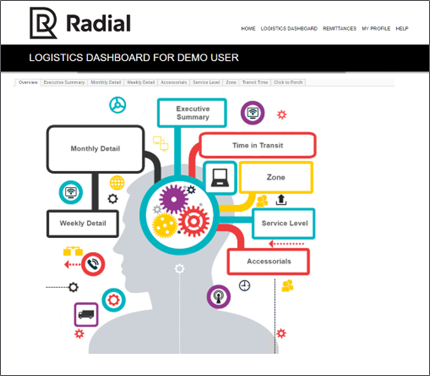
Logistics Dashboard
-
Remittances - Enables you to export billing data.
-
My Profile - Information about you.
-
Help
The flexible sorting feature enables you to narrow searches by:
-
Month: Up to 24 months in the past
-
Location: Only selected locations appear in the report
-
Location Type: DC, Inbound, or Returns
-
Shipping Mode: LTL, Parcel, or Postal
-
Carrier: FedEx, UPS, USPS
-
Client Code Service Type: Client-named shipment types/service levels, including Dropship
Several Quick Buttons enable you to:
-
Export: Image, Data, Crosstab, or PDF
-
Revert All: Resets all search features
-
Pause Updates: Stop data refresh and save search criteria
-
Refresh: Updates data
Reports
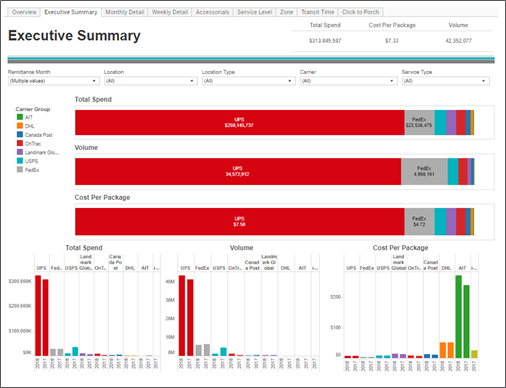
Executive Summary
The Executive Summary provides high-level information on cost and package volume, and a summary of the carriers in your network. For each carrier, you can view year over year tracking and drill down to see more details. You can also view information by:
-
Date
-
Location
-
Carrier
-
Service type
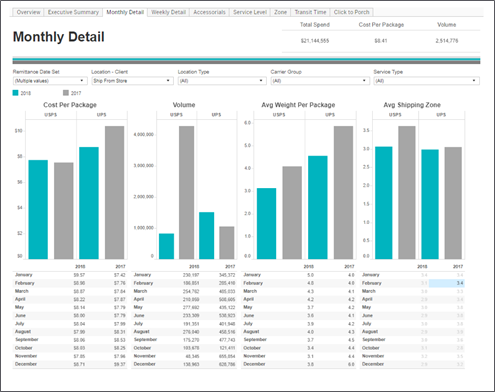
Monthly Detail
The Monthly Detail report shows monthly trends for your network suppliers, including:
-
Cost per package
-
Volume
-
Average weight per package
-
Average shipping zone
You view the information by date, location, carrier, or service type.
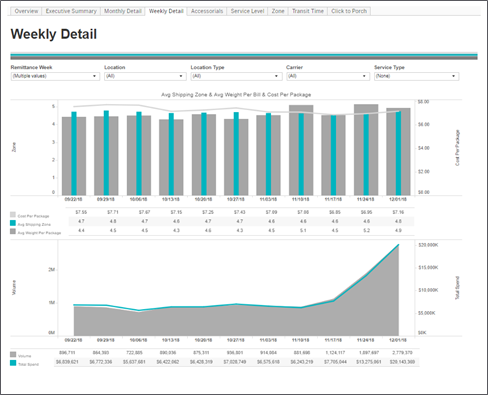
Weekly Detail
The Weekly Detail report is a weekly trend analysis that shows key package attributes, including:
-
Cost per package
-
Average weight per package
-
Average shipping zone
The volume and spend data show seasonal impact and key trends.
You can view the information by date, location, carrier, or service type.
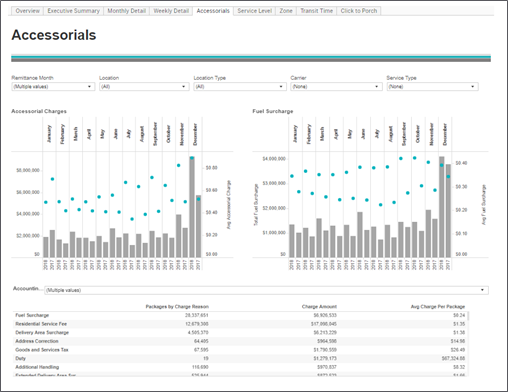
Accessorials
The Accessorials report provides insight into accessorial costs, volume, and trends. Using this report, you can identify accessorial charges to improve budgeting and mitigate costs.
You can view the information by date, location, carrier, or service type.

Service Level
The Service Level report enables you to analyze cost and service by destination state. You review service ranks by volume, freight, and fuel surcharges; and view the information by date, location, carrier, or service type.
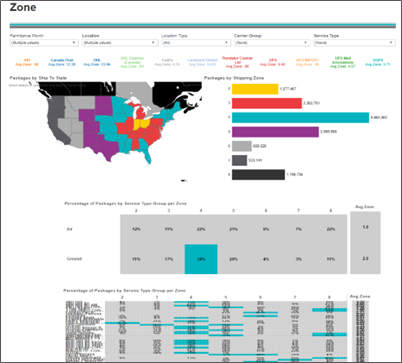
Zone
The Zone report enables you to analyze trends by service zone, including service utilization by ground and air. This analysis can help you identify opportunities to upgrade or downgrade service to optimize network performance.
You can view the information by date, location, carrier, or service type.
Transit Time
The Transit Time report enables you to view transit time averages by ship-to state. You can review the percentage of packages fulfilled within two days, three days, four days, and so on. The days in transit metrics cover both air and ground services.
You can view the information by date, location, carrier, or service type.
![]()
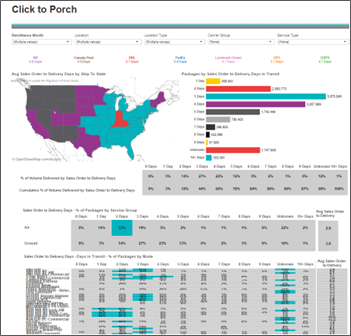
Click to Porch
The Click to Porch report enables you to analyze click-to-porch metrics by ship-to state, including distribution analysis by number or days and service.
You can view the information by date, location, carrier, or service type.