View Reports
Radial Order Management enables you to generate and view a varied set of report dashboards for both your store fulfillment and your omnichannel fulfillment.
View Omnichannel Report Dashboards
To generate and view reports for your omnichannel fulfillment:
- Click or tap the
 icon in the upper-left corner. The Main Menu appears.
 - Click or tap Reporting Dashboard. The Reporting Dashboard submenu appears.
- Click or tap Omnichannel Fulfillment Dashboard. The Omnichannel Fulfillment Dashboard screen appears.

- Select the time frame for your omnichannel dashboard. You can select from three pre-set options: Last 24 hours, Last 7 days, or Last 30 days.
- If you need a more specific time frame, you can specify it using the Search fields.
- Select a time range from the dropdown. You can select as few as five minutes or as much as 1 year.
- Select a start date. Click in the middle field, then use the calendar to navigate to the appropriate date.
- Select an end date. Click in the rightmost field, then use the calendar to navigate to the appropriate date.
- Click or tap the Search button.
The reporting dashboard instantly adjusts to show the appropriate metrics for the specified time frame.
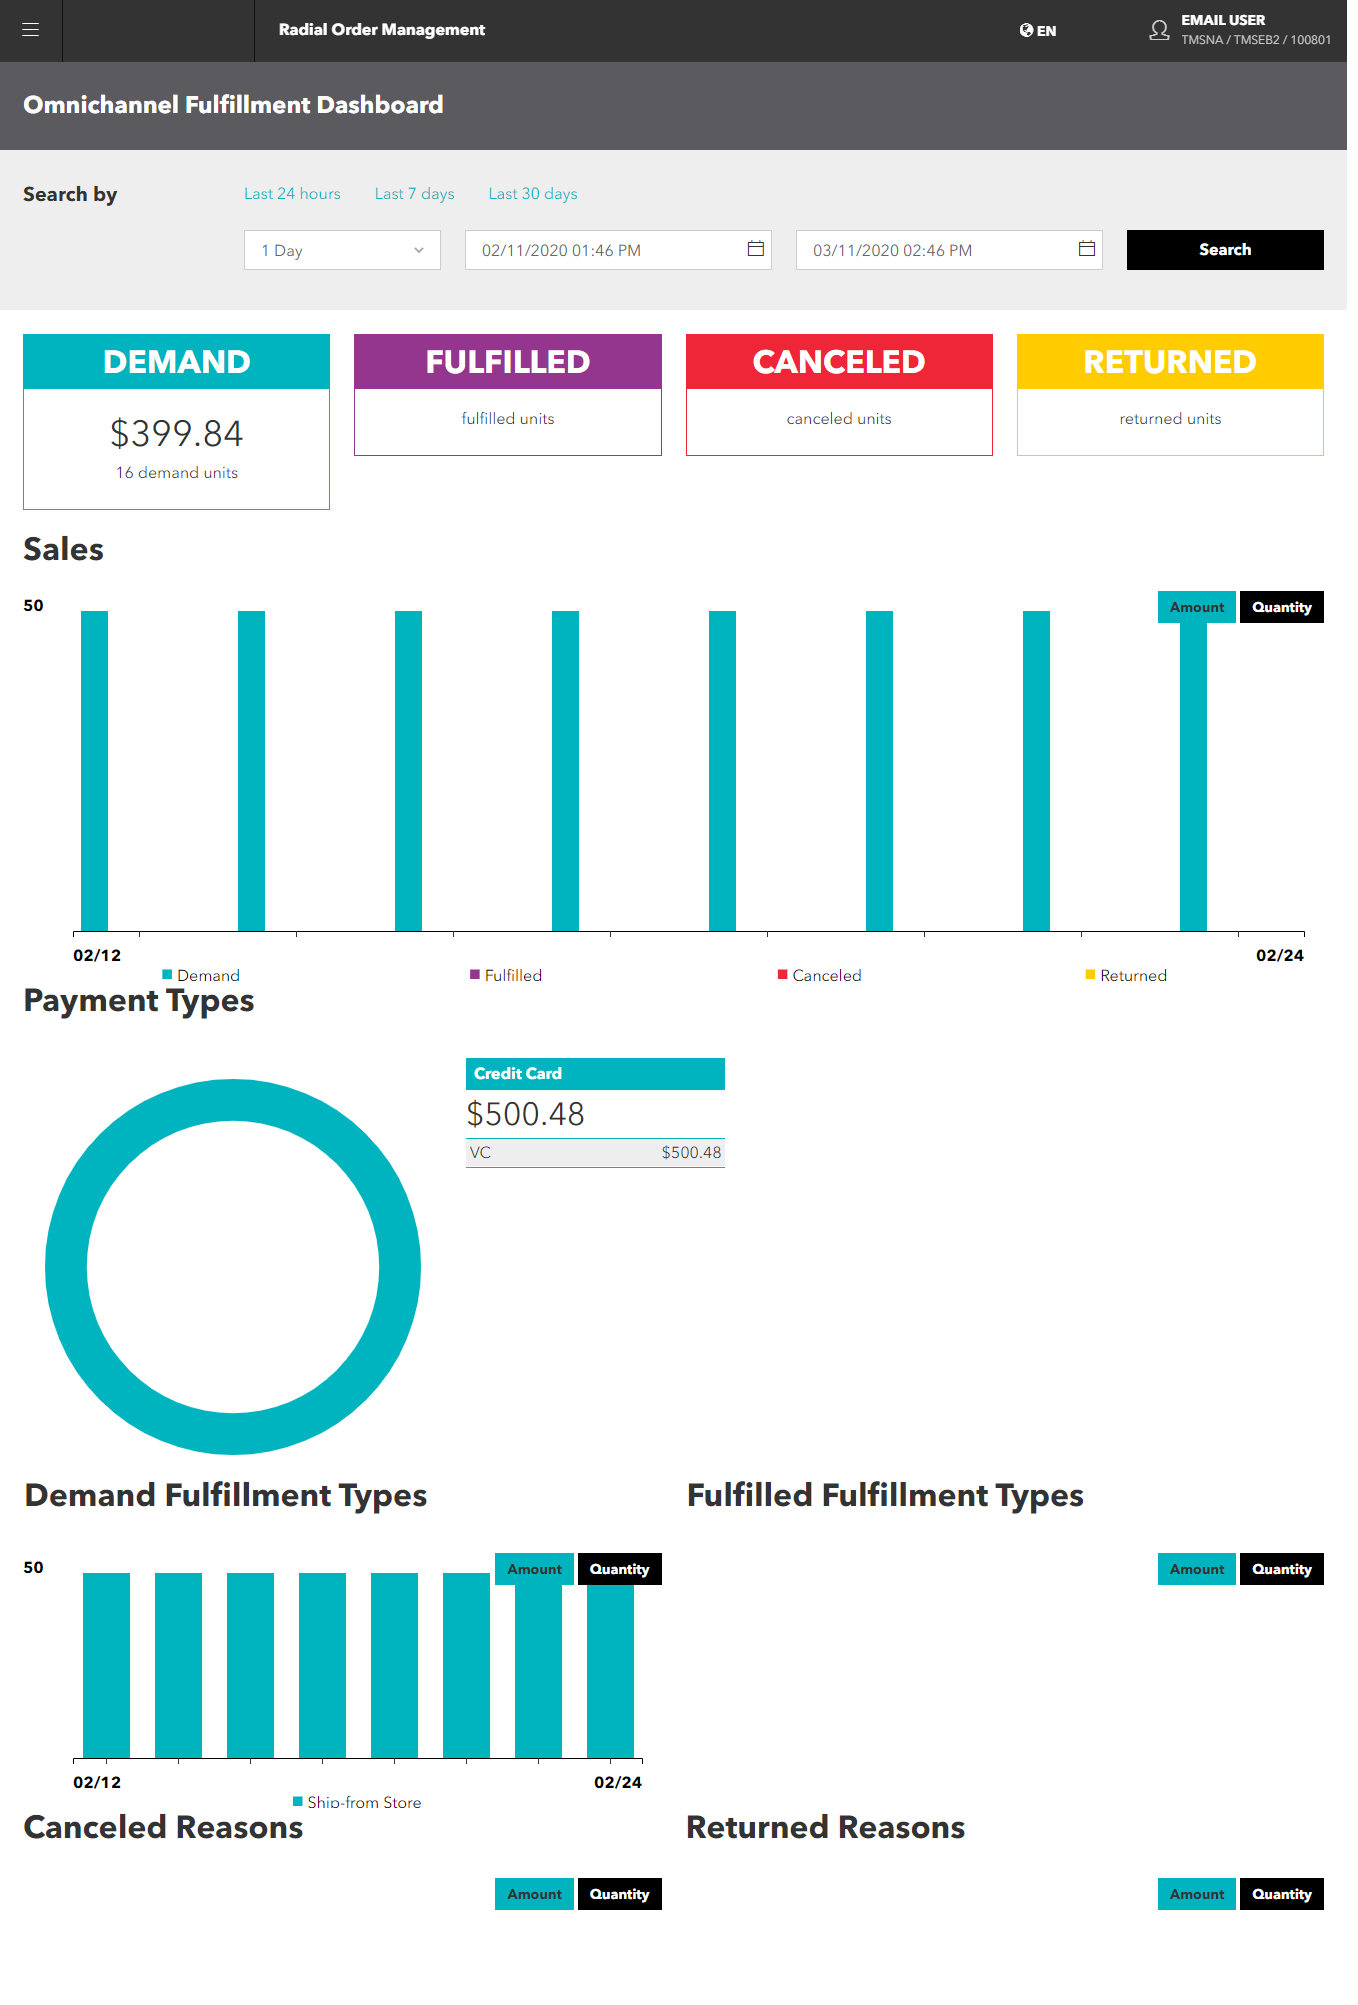
Across the top of the screen is a snapshot of your omnichannel fulfillment:
- Demand
- Fulfilled
- Canceled
- Returned.
Each category shows the dollar amount and number of units.
Following the snapshot are graphs of the following categories:
- Sales
- Payment Types
- Demand Fulfillment Types
- Fulfilled Fulfillment Types
- Canceled Reasons
- Returned Reasons.
Within each category, you can select the type of data displayed: the dollar amount or the quantity of items. When you click or tap the applicable button, the display changes to reflect your choice. To see the details for a data point on the graphs, hover over the data point. The amount and quantity for that specific data point appears.
View Store Report Dashboards
To generate and view report dashboards for individual store fulfillment:
- Click or tap the icon in the upper-left corner. The Main Menu appears.
- Click or tap Reporting Dashboard. The Reporting Dashboard submenu appears.
- Click or tap Store Fulfillment Dashboard. The Store Fulfillment Dashboard screen appears.

- Select the time frame for your store report dashboard. You can select from three preset options: Last 24 hours, Last 7 days, or Last 30 days.
- If you need a more specific time frame, you can specify it using the Search fields.
- Select a time range from the dropdown. You can select as few as five minutes or as much as 1 year.
- Select a start date. Click in the middle field, then use the calendar to navigate to the appropriate date.
- Select an end date. Click in the rightmost field, then use the calendar to navigate to the appropriate date.
- Click or tap the Search button.
The reporting dashboard instantly adjusts to show the appropriate metrics for the specified time frame.
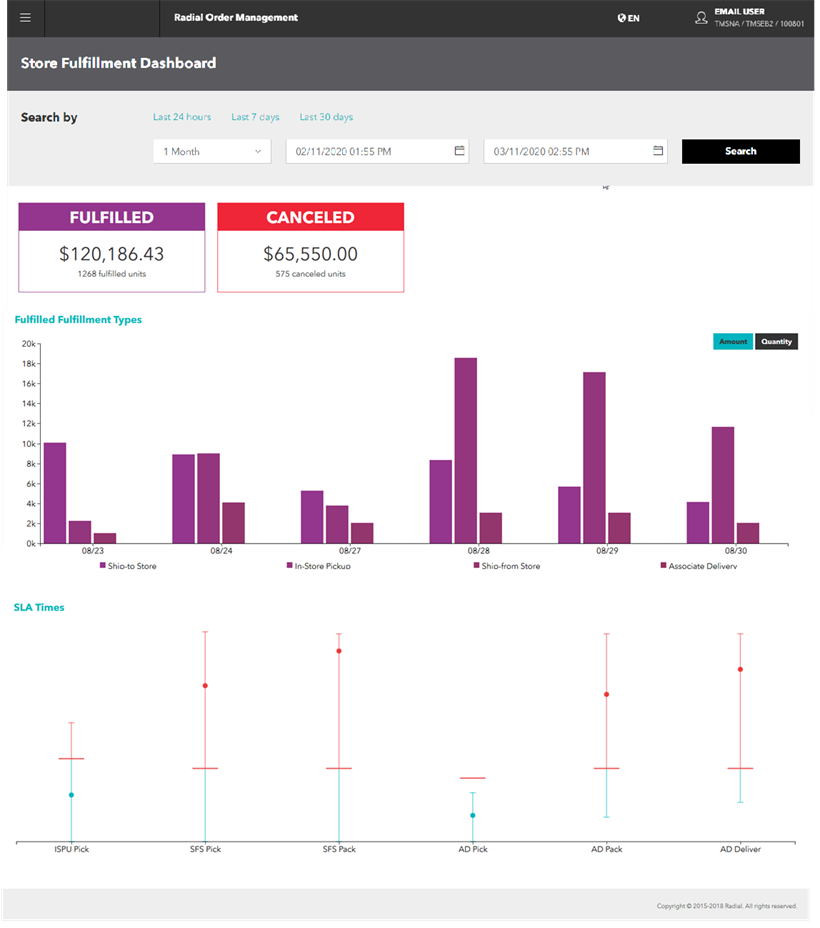
Across the top of the screen is a snapshot of your store fulfillment:
- Fulfilled
- Canceled
Each category shows the dollar amount and number of units.
Following the snapshot are graphs of the Fulfilled Fulfillment Types and the Service Level Agreement (SLA) Times.
Within the Fulfilled Fulfillment Types category, you can select the type of data displayed: the dollar amount or the quantity of items. When you click or tap the applicable button, the display changes to reflect your choice. To see the details for a data point on the graphs, hover over the data point. The amount and quantity for that specific data point appears.
The SLA Times category shows how well the store met its service level agreements for each fulfillment type.