Export Data
You can generate a PDF of a dashboard, report, or widget for printing or sharing. You can also save widgets as images and export data in CSV format.
Export a widget
You can export a widget in the following formats, depending on the widget type:
- CSV: Download the data described by the widget in a CSV file. If you have applied any filters, the filtered data is the data included in the file.
- Excel: Download the data described by the widget in an Excel file. When you export a pivot table to Excel, the data that is exported is the data that is displayed in your widget. This means that any active filters, layout structure, and masks that you have applied to your data are exported as well. For example, if you have modified how currency, percentages, or numbers are formatted in the widget in Radial, Inc., these will be reflected in your exported Excel file. Exporting to Excel maintains your pivot’s layout and structure, and values such as sub-totals, which are not maintained when you export a pivot table to CSV.
- Image: You can download a widget as an image in PNG format. The image size will reflect the size of the widget on the screen when you download it. To create a larger image, enlarge the widget space in the dashboard, or open the widget in edit view, to get a bigger picture.
- PDF: Download the widget as a PDF. For Table widgets, you can customize how your table is displayed in your PDF including the table’s orientation and page size. In the PDF Report Settings, the first 14 pages of your Pivot table are displayed in the preview window, however, when you export your Pivot table to PDF, the entire table is included, up to 10,000 rows on multiple pages. For more information, see Customizing PDF Reports.
To download a widget:
- In dashboard view, click the widget’s menu, select Download, and select the file type.
- In edit widget view, click the download icon, select Download, and select the file type.
Tips for downloading large tables and reports:
- CSV is the recommended format for downloading large tables. Exports in CSV format are rendered much faster than exports in Excel format. You can open a CSV file in Excel and save it as an Excel file.
- For some large tables, the option to export to Excel format is not available.
- For very large tables, for example, a table with 100,000 rows, export might not be available or practical. Consider using filters to reduce the number of rows, for example, by specifying a shorter time period.
Download a Dashboard as an Image
You can download the dashboard as an image. This can be useful for including the dashboard in a presentation or web site, for example.
To download the image:
- At the top right of the dashboard, click the action button (
 ), and select Download > Download Image.

-
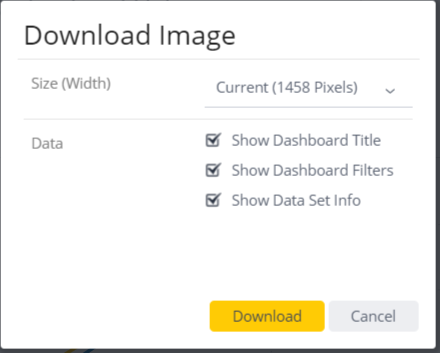
Select any of the following options:
-
Show Dashboard Title: Turning this on will display the dashboard name at the top of the image.
-
Show Dashboard Filters: Turning this on will display a summary of the dashboard filter selections at the top of the image.
-
Show Data Set Info: Turning this on will display the ElastiCube name and last build time at the top of the image.
-

Create a PDF Report
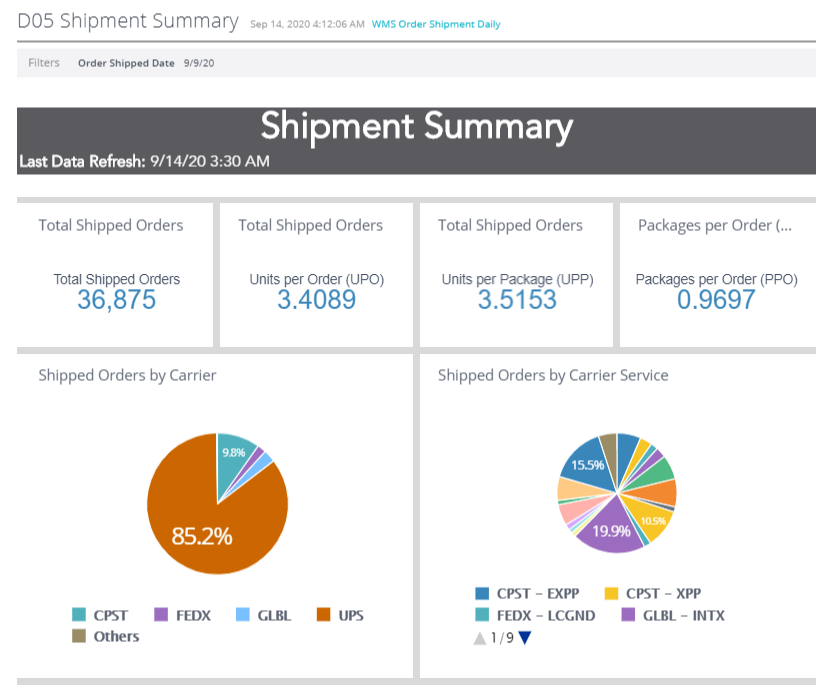
When you need to take copies of your dashboards with you for meetings or sharing with others, you can generate a PDF report of your dashboard.
By clicking the PDF icon on your dashboard, you can customize your dashboard’s appearance through the PDF Report Settings page. After you have defined how your dashboard is to be displayed, you can download your dashboard locally as a PDF.
To create a PDF report:
- From your dashboard menu, click the PDF icon
The PDF Report Settings page is displayed.
- Customize how your dashboard is displayed in the PDF. For more information, see Customizing PDF Reports.

-
Click the download button (
 ). The dashboard is downloaded locally as a PDF file.
Customize PDF reports
If you need to share dashboards with other users, or create a hardcopy for yourself, Radial, Inc. allows you to send an email report to your users or export your dashboard to PDF. Dashboards in email reports or PDFs though look different compared to online dashboard, because they serve different purposes. Use the Report Settings window to customize and create formatted email reports and PDFs according to your requirements. In Report Settings you can define both the content and design of your report quickly and easily.

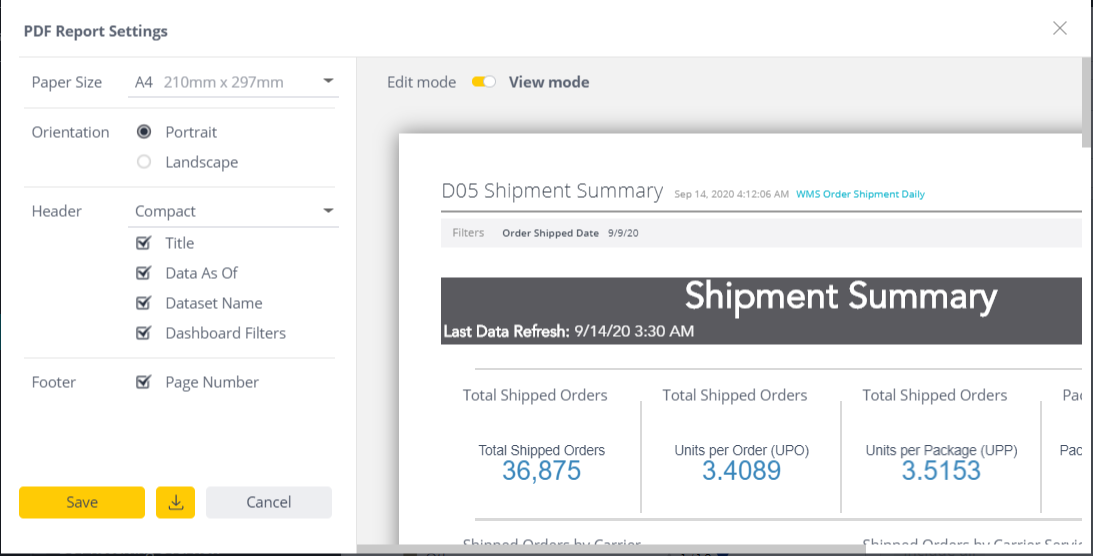
From the PDF Report Settings page, you have two modes, Edit mode, for customizing your PDF, and View mode, for seeing how the dashboard will be displayed in the PDF. In Edit Mode, all the settings you can apply to your report are displayed in the left menu.
In Edit mode, you can set the size of your widgets by selecting and dragging the borders of each widget. These borders are displayed when Edit mode is toggled on.

In View and Edit mode, you can define your dashboard’s orientation, its layout, and what is displayed in the header and footer on your report.
After you have customized your report, you can save the settings and use them when you share a report or when download a report as a PDF.
To customize a PDF report:
- In your dashboard’s menu, click . The PDF Report Settings page is displayed.
- Edit the dashboard by selecting any of the options (listed below).
-
Click Save to save your settings when sharing reports, or click the download button (
 ) to download your report.
PDF Report Settings Options
|
Setting |
Description |
|---|---|
|
Paper Size |
The size of the email report in the PDF. |
|
Orientation |
The orientation of the dashboard in the PDF, landscape or portrait. Landscape orientations display the dashboard horizontally while portrait orientations display the dashboard vertically. |
|
Header |
The design and content of your report’s header. The header is displayed on the top of each page or your PDF report. From the Header list, you can define how your header is to be displayed: Compact, Medium, Large, or No Header. After you have set the design, you can determine what information is included in the header. Title: Select to display the dashboard name at the top of the PDF. Dashboard As Of: Select to display the ElastiCube name and last build time at the top of the PDF. Dataset Name: Select to display the name of the ElastiCube that contains the dashboard’s data. Dashboard Filters: Select to display dashboard filter selections. |
|
Footer |
The content displayed in the footer section of each page of your report. You can display the following information: Page Number: Select to display the page number on each page of the report. |