Work with Graphs and Charts
The visual components of a dashboard are called widgets. Graphs and charts are widgets that show geometric shapes to visualize a set of data. In many cases, you can interact with the widgets to reveal additional data.
Hover to see additional information
In many graphs and charts, you can hover over a graph element to see additional information, including the numerical data used to create the graphical display.
To see additional information, hold your mouse pointer over:
- A segment of a pie chart or circle graph
- A bar or bar segment in a bar chart
- A point in a line graph
Make selections in a widget
You can click on a specific portion of a widget to select it. This filters the dashboard according to the selected data by adding a filter to the dashboard’s Filters panel.
You can also use the selection to drill down in the widget (see Drilling Down in a Widget, below).
To select an item in a widget for filtering:
-
Left-click an item in a widget to automatically select it and add a dashboard filter according to the selection.
-
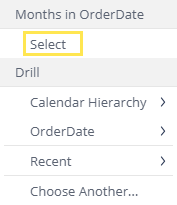
For multiple selection, use the Ctrl key. When released, a menu will appear. Click Select.
-
In chart widgets, you can drag and draw the area to be selected, as shown below:
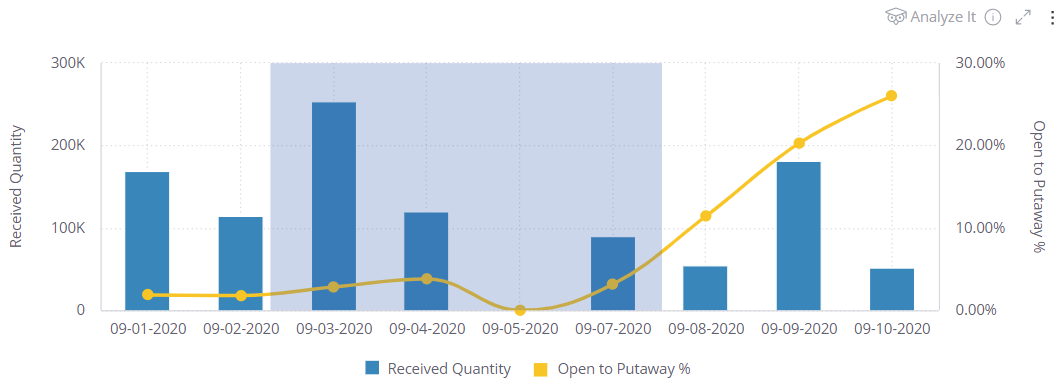
When you select a portion of the widget, an expand button ( ) appears in the widget's menu bar. Click
  to expand your view of the selection.
Drill down in a widget
You can drill down into your data in many widgets to get an in-depth view of a selected value.
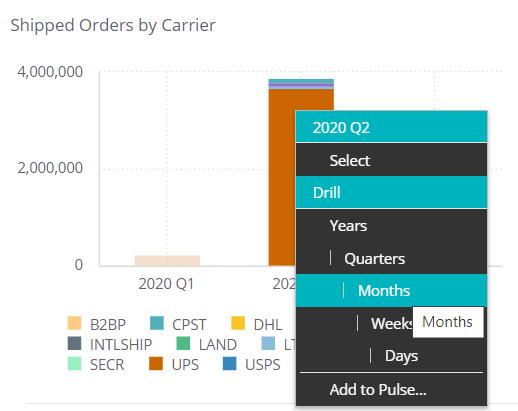
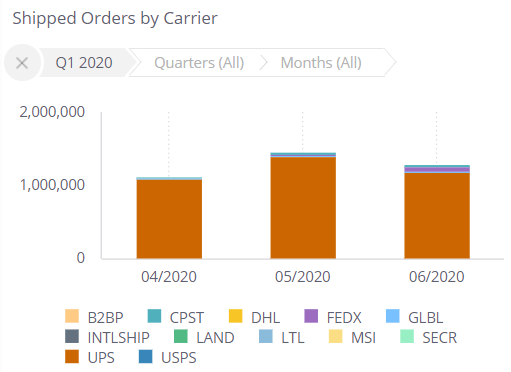
In the example shown below, the chart on the left shows shipping data by quarter. On the right side, the chart shows a drill down into the months of the selected quarter.
To drill down into a chart:
- Right-click on the item in the widget into which you want to drill down.
- Do one of the following.
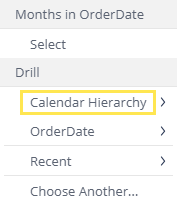
- To manually select the drill hierarchy path, select Drill Into, and then in the In the Data Browser, select the field into which to drill down. If you have already drilled into this chart, then you will have shortcuts to previously selected fields, or select Choose Another Field to select a different field for the first time.
- Select a predefined drill hierarchy (if available). Predefined drill hierarchies are defined by the dashboard's owner.
To drill up to a higher level, click on a breadcrumb. To drill all the way up, click on the X icon.
