Get Started
Radial Reporting & Analytics is an interactive web application composed of dashboards and reports with a wealth of insights into your business. Each dashboard or report focuses on a specific business area and is supported by its own data set (called an Elasticube).
Dashboards present information visually in graphs and data points. Reports typically present a larger volume of data structured in table format. Dashboards and reports both provide options for filtering the underlying data by criteria such as time period, business entity, and location.
Radial Analytics runs in the following HTML5 supported browsers:
- Google Chrome
- Firefox
- Safari version 7 and higher
Microsoft Edge is not currently supported.
A screen resolution of 1920x1080 is recommended.
The Dashboards Window
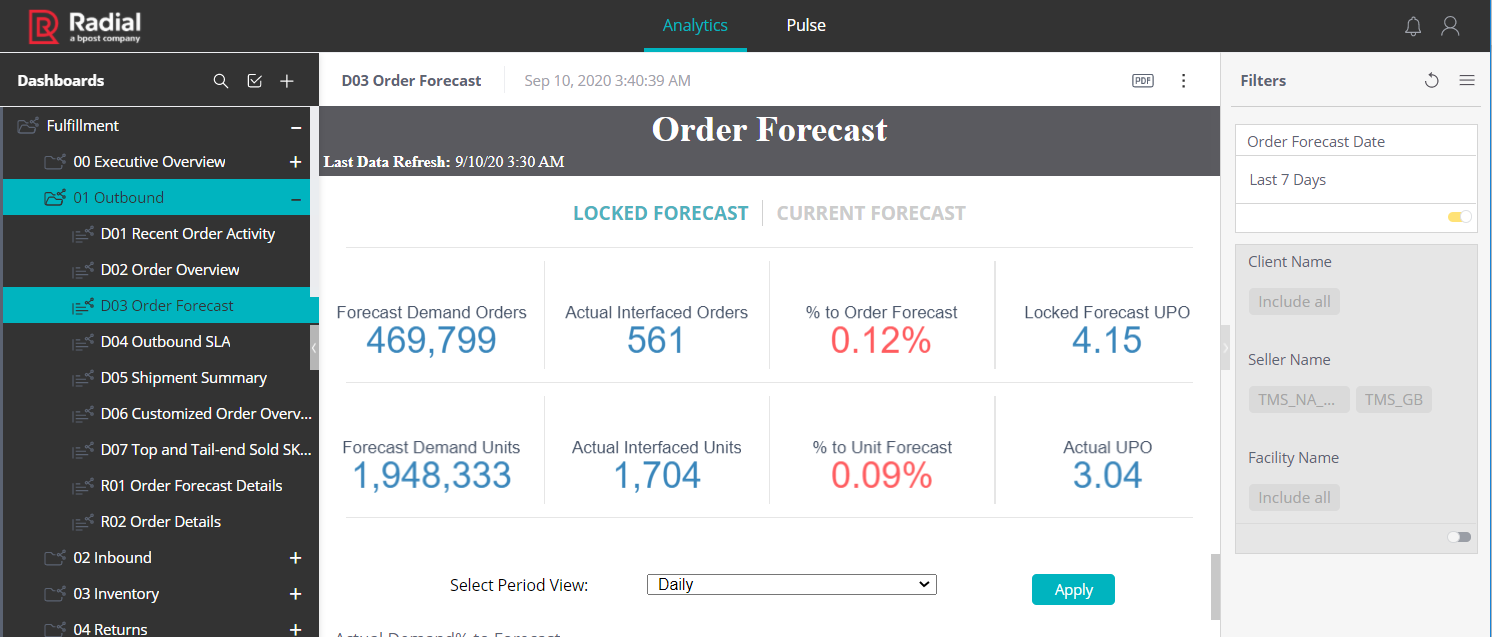
The Dashboards window includes three main segments.
On the left side, the menu pane lets you navigate to dashboards and reports. See Navigate the System.
The main center area displays the content of a dashboard or report. See Work with Graphs and Charts and Work with Tables and Reports.
The filter panel on the right side lets you filter the data in a dashboard. See Use Filters.
On the page's black title bar, the Pulse link leads to the Pulse page, where you can organize your own most important KPIs. Use the Analytics link to return to the Dashboards page.

A dashboard's header tells you key information about the freshness of the data. The white title bar displays the latest build date and time of the Elasticube data set that supports the dashboard. The gray header bar displays the Last Data Refresh time, the most recent time that data for this dashboard was loaded into the Elasticube.
Note that the Last Data Refresh time does not mean that the dashboard's data includes transactional records from a source system up to that timestamp. There is always a lag time related to the delivery of batches of data from the source system to the data warehouse that supports Radial Reporting & Analytics.

The white title bar also includes a PDF button that lets you save the dashboard in PDF format, and an action button  that brings up a menu of options and actions for the dashboard. For more information, see Export Data.
More Information
You can read or download the following PDFs to get a quick overview of Radial Reporting & Analytics features and dashboards.
- Radial Reporting & Analytics Introduction
- Radial Reporting & Analytics Fulfillment Dashboards
- Radial Reporting & Analytics Order Management Dashboards
To get started, use the tips in this section to:
- Navigate the System
- Use Filters
- Work with Graphs and Charts
- Work with Tables and Reports
- Export Data
- Work with Pulse